
A small team needs monitoring that reveals meaningful failures and makes the next action clear. A long list of green indicators is less useful than a focused set of checks covering the services customers depend on, with someone responsible for responding.
This website monitoring checklist starts with availability and response validation, then adds dependencies, background work and the operational habits that keep coverage useful. Work through it in order of risk. You do not need to configure every possible monitor before your first check becomes valuable.
For each item, record the service, its owner and what evidence will tell you the setup works. That turns a checklist into an operating process instead of a one-time setup exercise.
1. List the services that matter to users
Begin with the workflows people actually use: opening the website, signing in, calling the API, uploading a file or receiving a scheduled report. Map those workflows to the pages, endpoints and background tasks you can test.
Separate production from staging and name them explicitly. A working test environment should never be mistaken for evidence that the public product is healthy.
Assign a primary owner for each important service and identify a backup person or support route. In a two-person team, this can be simple, but it still needs to be explicit. Include third-party dependencies and record where their service information can be found.
Ready when: the team can explain which customer workflows are covered and who handles a failure in each one.
2. Add external availability checks
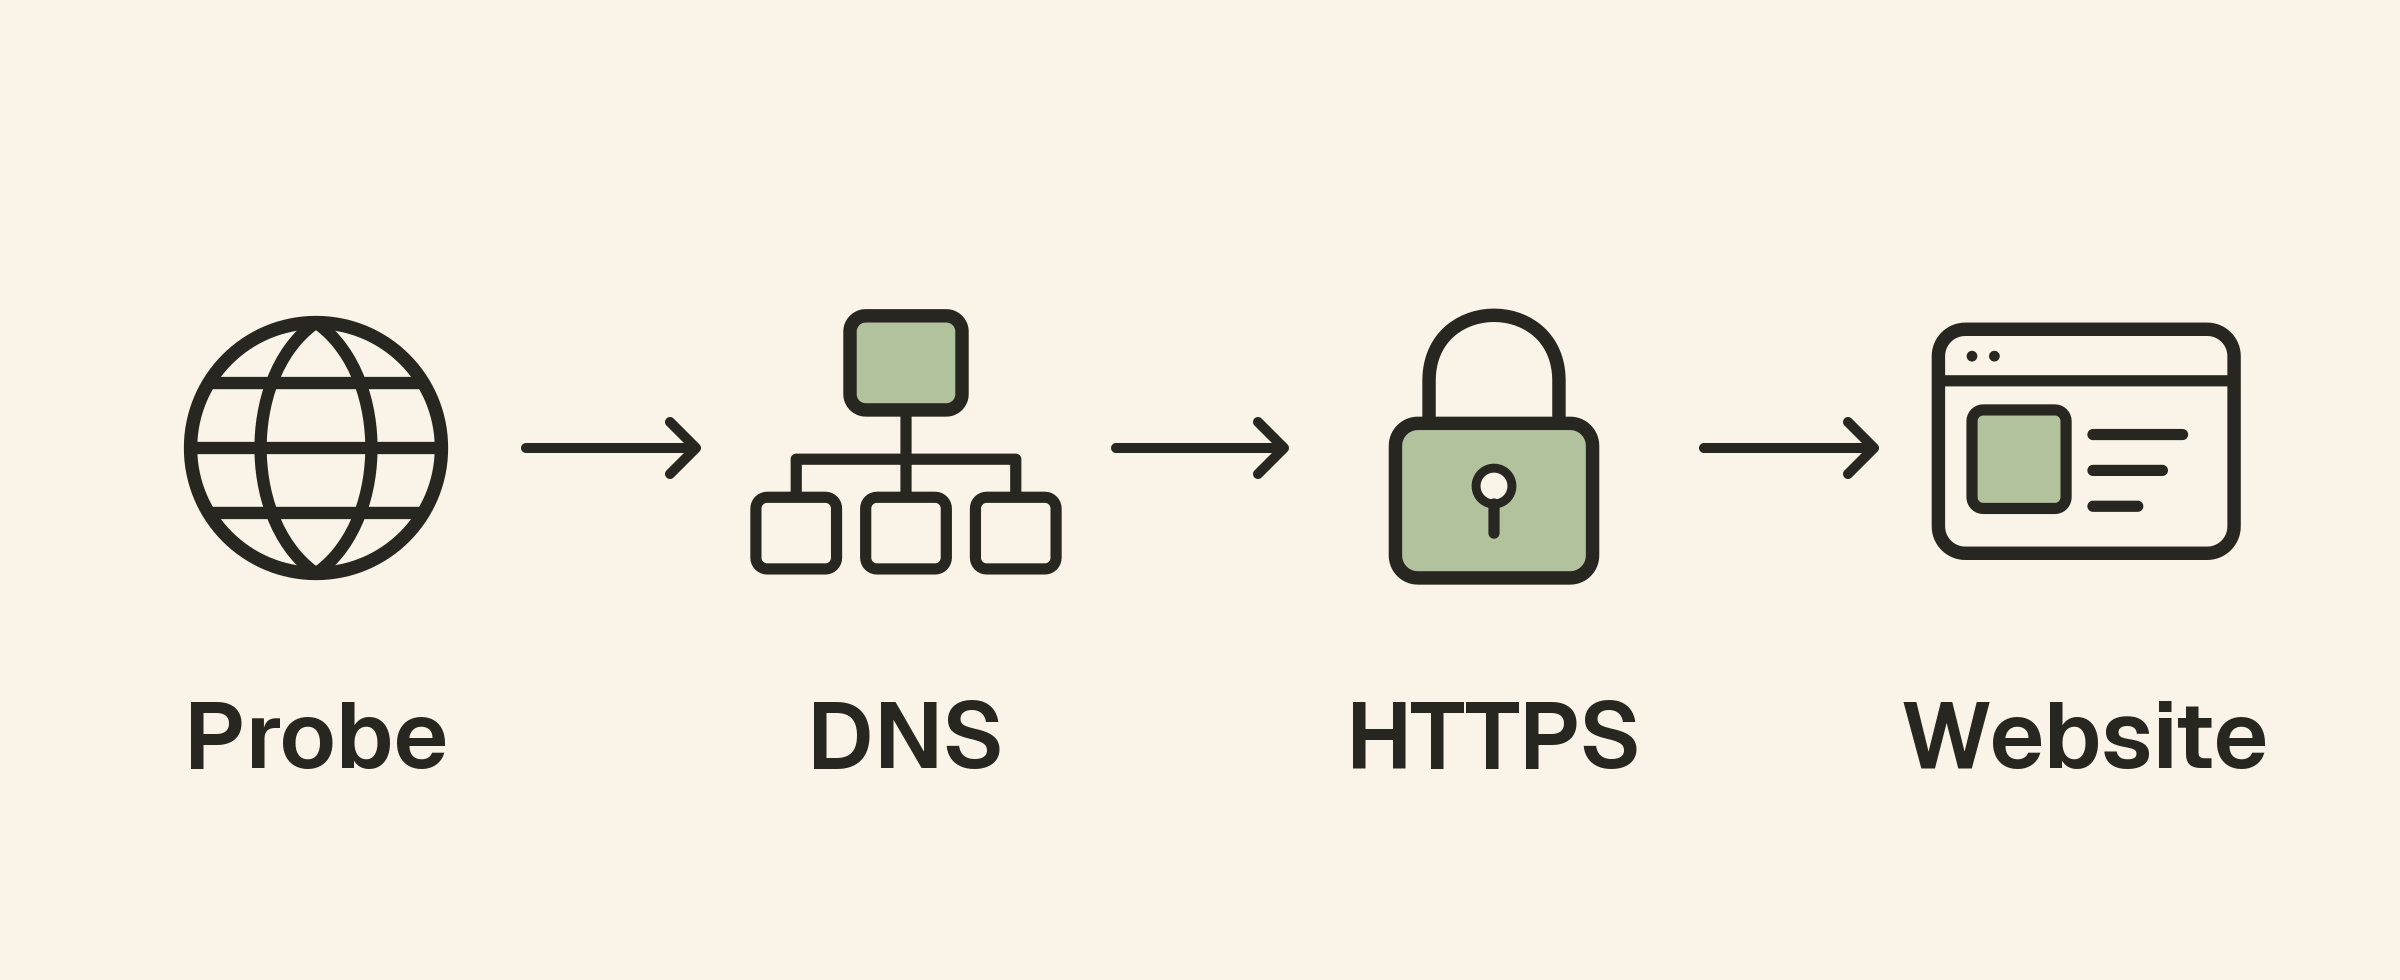
Create a website monitor for your main public site and other important entry points. An external check observes the service from outside your infrastructure, which can reveal failures a local process check misses.
Choose the actual hostname visitors use. A check of a server’s IP address is not equivalent to checking DNS resolution, HTTPS and routing for the public name.
Pick check locations relevant to your audience and understand how regional results affect alerts. A result from one location is evidence about that path at that moment, not proof that every visitor can reach the site.
Ready when: a controlled test shows that an unavailable endpoint is recorded as failed and a working endpoint is recorded as healthy.
The uptime monitoring introduction explains intervals, availability percentages and the limits of periodic checks.
3. Define what a correct response looks like
Do not stop at “the server answered.” Choose the expected status code and add stable content assertions where appropriate. A generic error document or sign-in redirect can otherwise pass an overly broad rule.
For an API, validate meaningful JSON fields and response headers using API monitoring. Prefer a predictable read-only request or a deliberately controlled synthetic workflow. Avoid making a frequent monitor create real orders, send customer email or change production records.
Keep assertions resilient to legitimate changes. A randomly generated identifier or a product list that changes every day is rarely a good fixed-value condition.
Ready when: the monitor fails on a representative incorrect response, not only when the whole endpoint disappears. See the API setup guide for supported rules.
4. Choose intervals and timeouts around response needs
Decide how long a failure can remain unnoticed before it becomes a serious problem. Use that decision to select an appropriate check interval, timeout and consecutive-failure rule.
Short intervals can reduce detection delay, while confirmation rules can reduce transient noise. Both have costs and limits. Several failed checks at a long interval may produce a much later notification than the team expects.
Set request timeouts using normal endpoint behavior and the user-facing requirement. A very tight timeout can create noise; a very loose timeout can hide a service that is effectively unusable for its callers.
Ready when: the team understands the approximate detection delay and has tested it under a safe failure scenario.
5. Watch certificates, domains and DNS
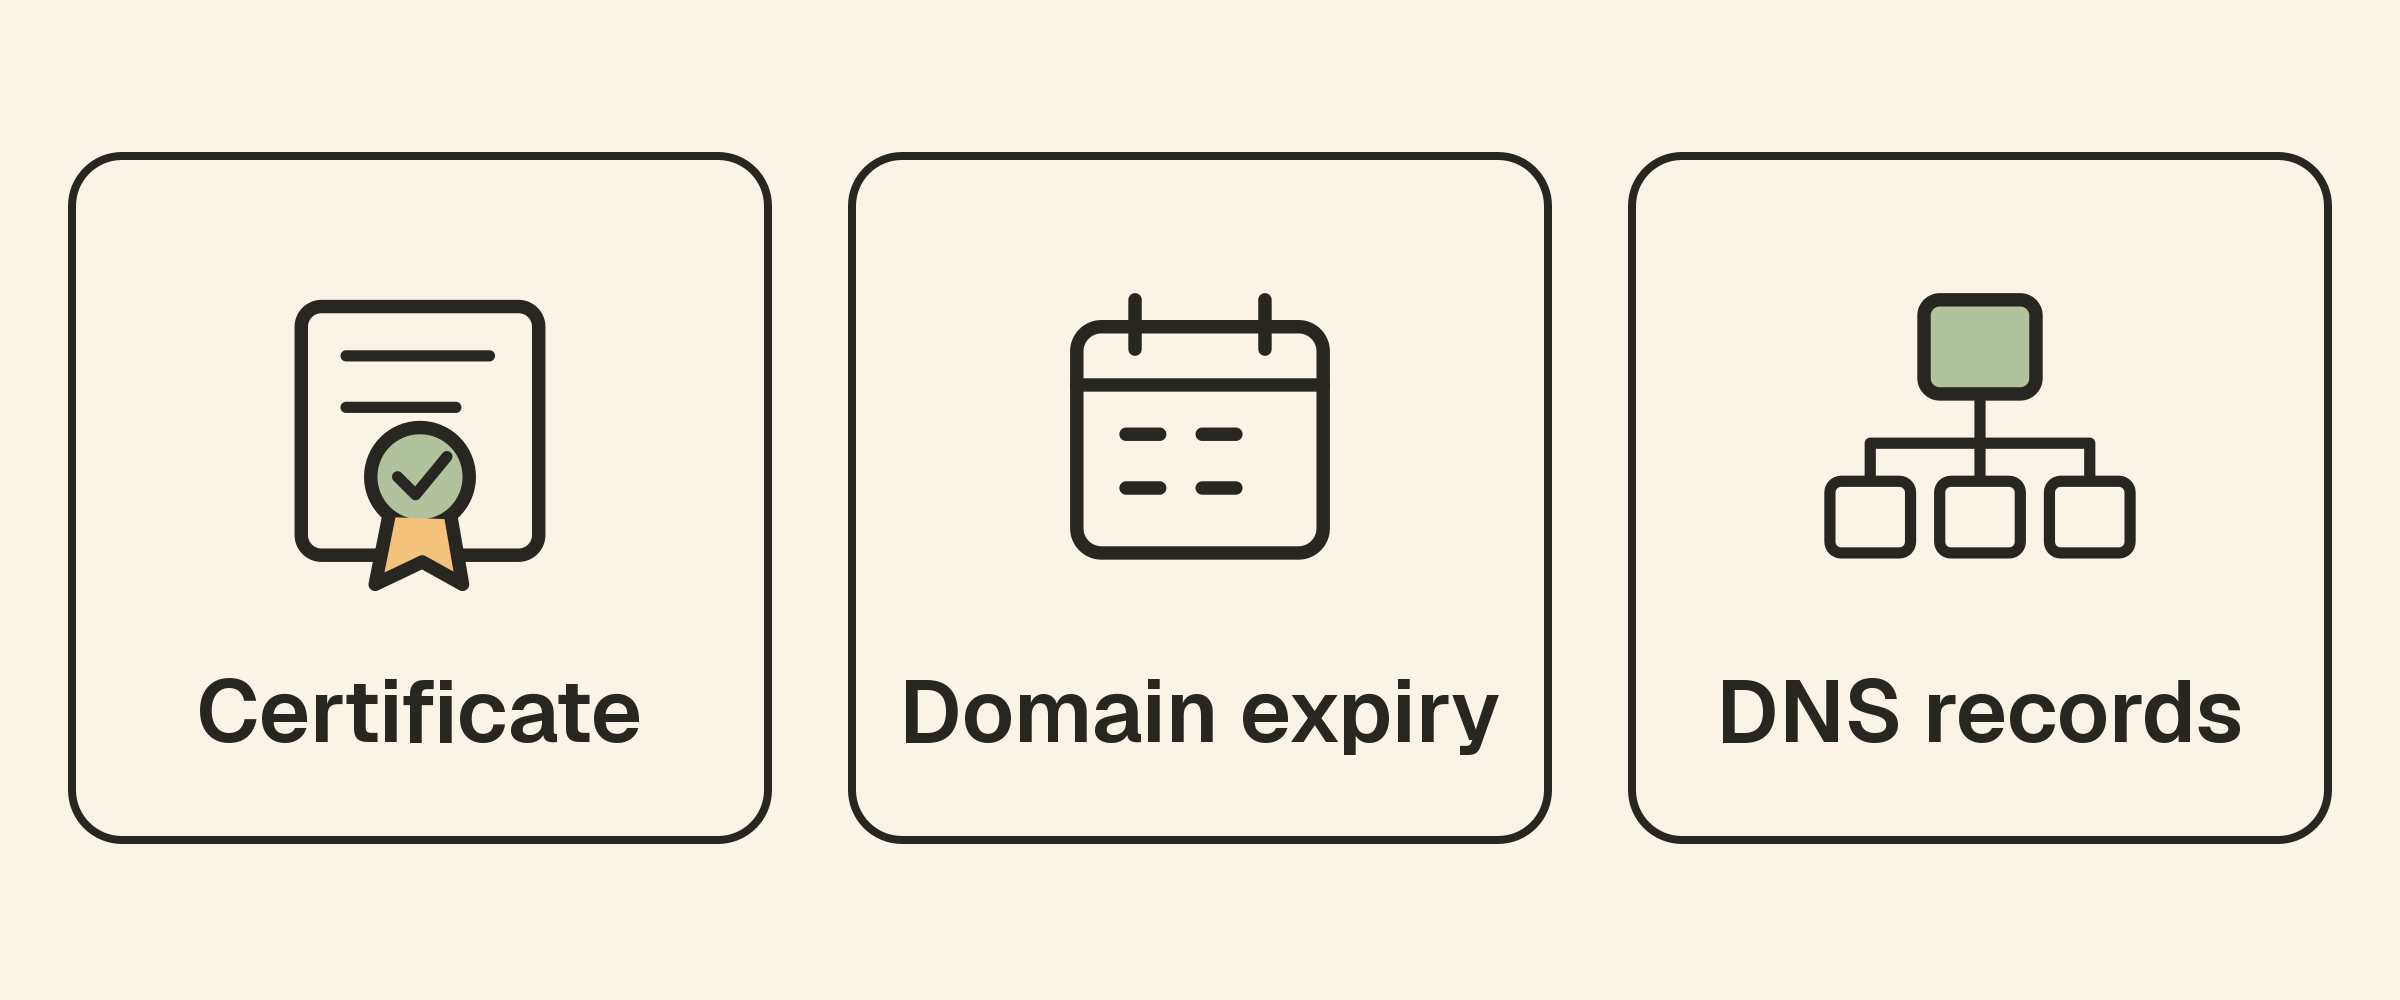
Add SSL checks for important HTTPS endpoints, domain-expiry monitoring for registrations and DNS monitoring for critical records. These cover separate dependencies.
Automatic certificate renewal is helpful, but verify the certificate the live endpoint presents. Domain ownership and certificate validity also have different expiry dates and different owners in some organizations.
For DNS, use expectations that match the service. A managed CDN may legitimately return changing addresses, so a single fixed-address rule can be inappropriate.
Ready when: each important dependency has a clear owner, useful warning thresholds and a tested notification route. The SSL monitoring article explains why renewal and deployment need separate verification.
6. Add host context where you control the infrastructure
If your team administers servers, collect the metrics needed to investigate problems: CPU, memory, storage, load and relevant process or network activity. Monitor actual host resources rather than accidentally observing only a collector container’s own environment.
Use host monitoring where available to your account and environment. Review the host documentation for requirements and supported setup. Managed hosting may instead provide its own diagnostics.
Choose thresholds based on the machine’s workload. A temporary CPU spike is different from sustained resource pressure accompanied by slow requests.
Ready when: an investigator can connect an external failure to the relevant machine and inspect useful historical context. Read website versus server monitoring for the difference between these signals.
7. Monitor quiet background work
Scheduled backups and imports can stop while the homepage stays healthy. Add heartbeat monitoring for critical jobs and send the completion signal only after the task meets its success criteria.
Set the expected deadline using the schedule, normal runtime and a reasonable allowance for delays. Document the timezone. Use separate monitors for independent jobs so one successful task cannot hide another task’s silence.
A backup heartbeat does not prove restorability. Keep backup verification and periodic restore testing in your operating process.
Ready when: a controlled missed completion triggers an alert. The cron and backup heartbeat guide walks through this pattern.
8. Test alerts and escalation end to end
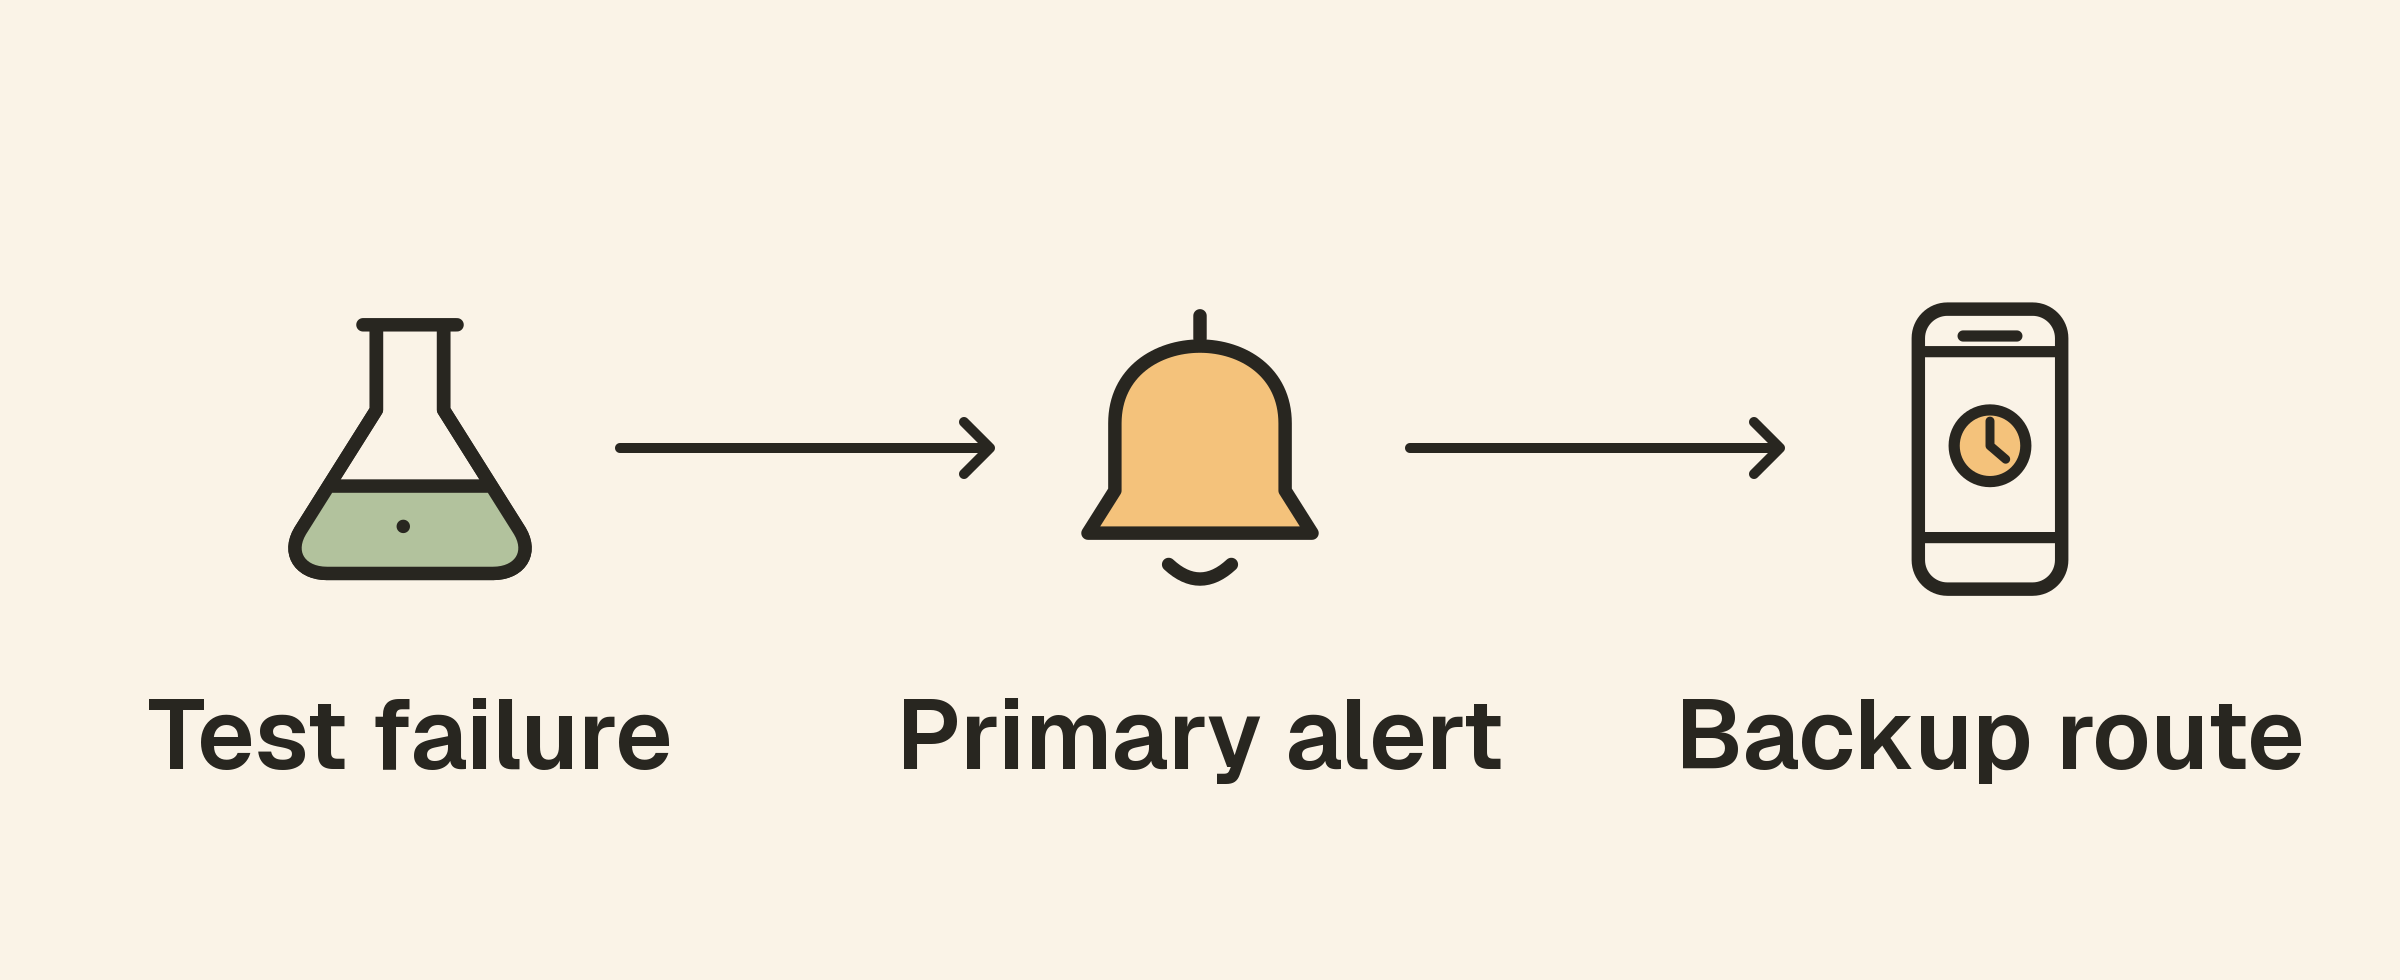
Configure destinations, then assign them to the relevant monitors. Verify the actual message on the channel someone watches. A saved destination is not proof of delivery or ownership.
Decide which failures require an immediate interruption and which can wait for ordinary review. Tune reminders and quiet hours accordingly, and explain how urgent conditions reach a backup responder.
Include enough context to start investigating: environment, service name, observed failure and a link to the monitor. Keep secrets and private customer data out of messages.
Ready when: the primary route, acknowledgement behavior, escalation and recovery notification have been tested. Use the alert guide as the configuration reference.
9. Prepare customer communication
A public status page can give customers a shared place to check incidents and maintenance. Display services they recognize and decide who publishes updates.
Keep a short incident template ready: impact, verified progress and the next update time. Do not wait for a confirmed cause before acknowledging verified disruption, and do not publish an untested workaround.
Ready when: the page is linked from your help material and staff can update it during a product outage. Follow the status-page setup guide for the available controls.
10. Review coverage after changes
Revisit checks after deployments that change endpoints, authentication, domains or infrastructure. Remove deliberately retired services, update owners and test new credentials before discarding old monitoring configuration.
After an incident, ask what detected it, which alerts helped and which failure modes were invisible. Add coverage for a demonstrated gap rather than every hypothetical metric.
Ready when: someone owns this review and recent changes have not left checks pointing to obsolete services.
Frequently asked questions
What should a small team configure first?
Start with an external check for a critical service, a meaningful success rule and an alert that reaches a named owner. Add dependency and background-job checks according to risk.
How many monitors do we need?
Enough to cover distinct important behaviors. The number depends on the architecture and workflows, not the size of a competing team’s dashboard. The monitoring directory can help match each requirement to a check.
Is this checklist complete once every item is done?
It is a starting process. Monitoring needs to evolve with the product, team and incidents. Repeat the relevant checks whenever those conditions change.