
Server metrics help explain a slow website by showing what was happening on the machines behind it. CPU utilization, memory pressure, storage activity and system load can reveal useful clues, but no single chart proves the cause of a slow request.
A reliable investigation begins with the user-visible symptom, defines when and where it occurs, and then compares that timeline with infrastructure and application evidence. The objective is to find a supported explanation and verify recovery after a targeted change.
This guide focuses on a practical workflow for teams that operate their own servers. If your site runs on managed hosting, use the equivalent diagnostics your provider offers and keep external checks in place.
Confirm what “slow” actually means
Identify the affected page or API, the observation time and who experiences the problem. Is every request slow, only the first request, or a particular workflow such as search or checkout? Does the problem occur in one region or across several?
A page can feel slow because the server responds late, the network path is slow, large assets download slowly or the browser spends time running JavaScript. Those conditions need different evidence.
Use external website checks to establish whether the response time changed, then inspect the timing breakdown where your tool provides it. A delay during name resolution points toward a different layer from a delay after the connection is established.
Time to first byte is useful context, but it includes more than application execution alone. Do not treat that measurement as a direct substitute for server-side request tracing. Browser performance tools are also needed when the complaint concerns rendering or interaction after the response arrives.
Define one investigation window
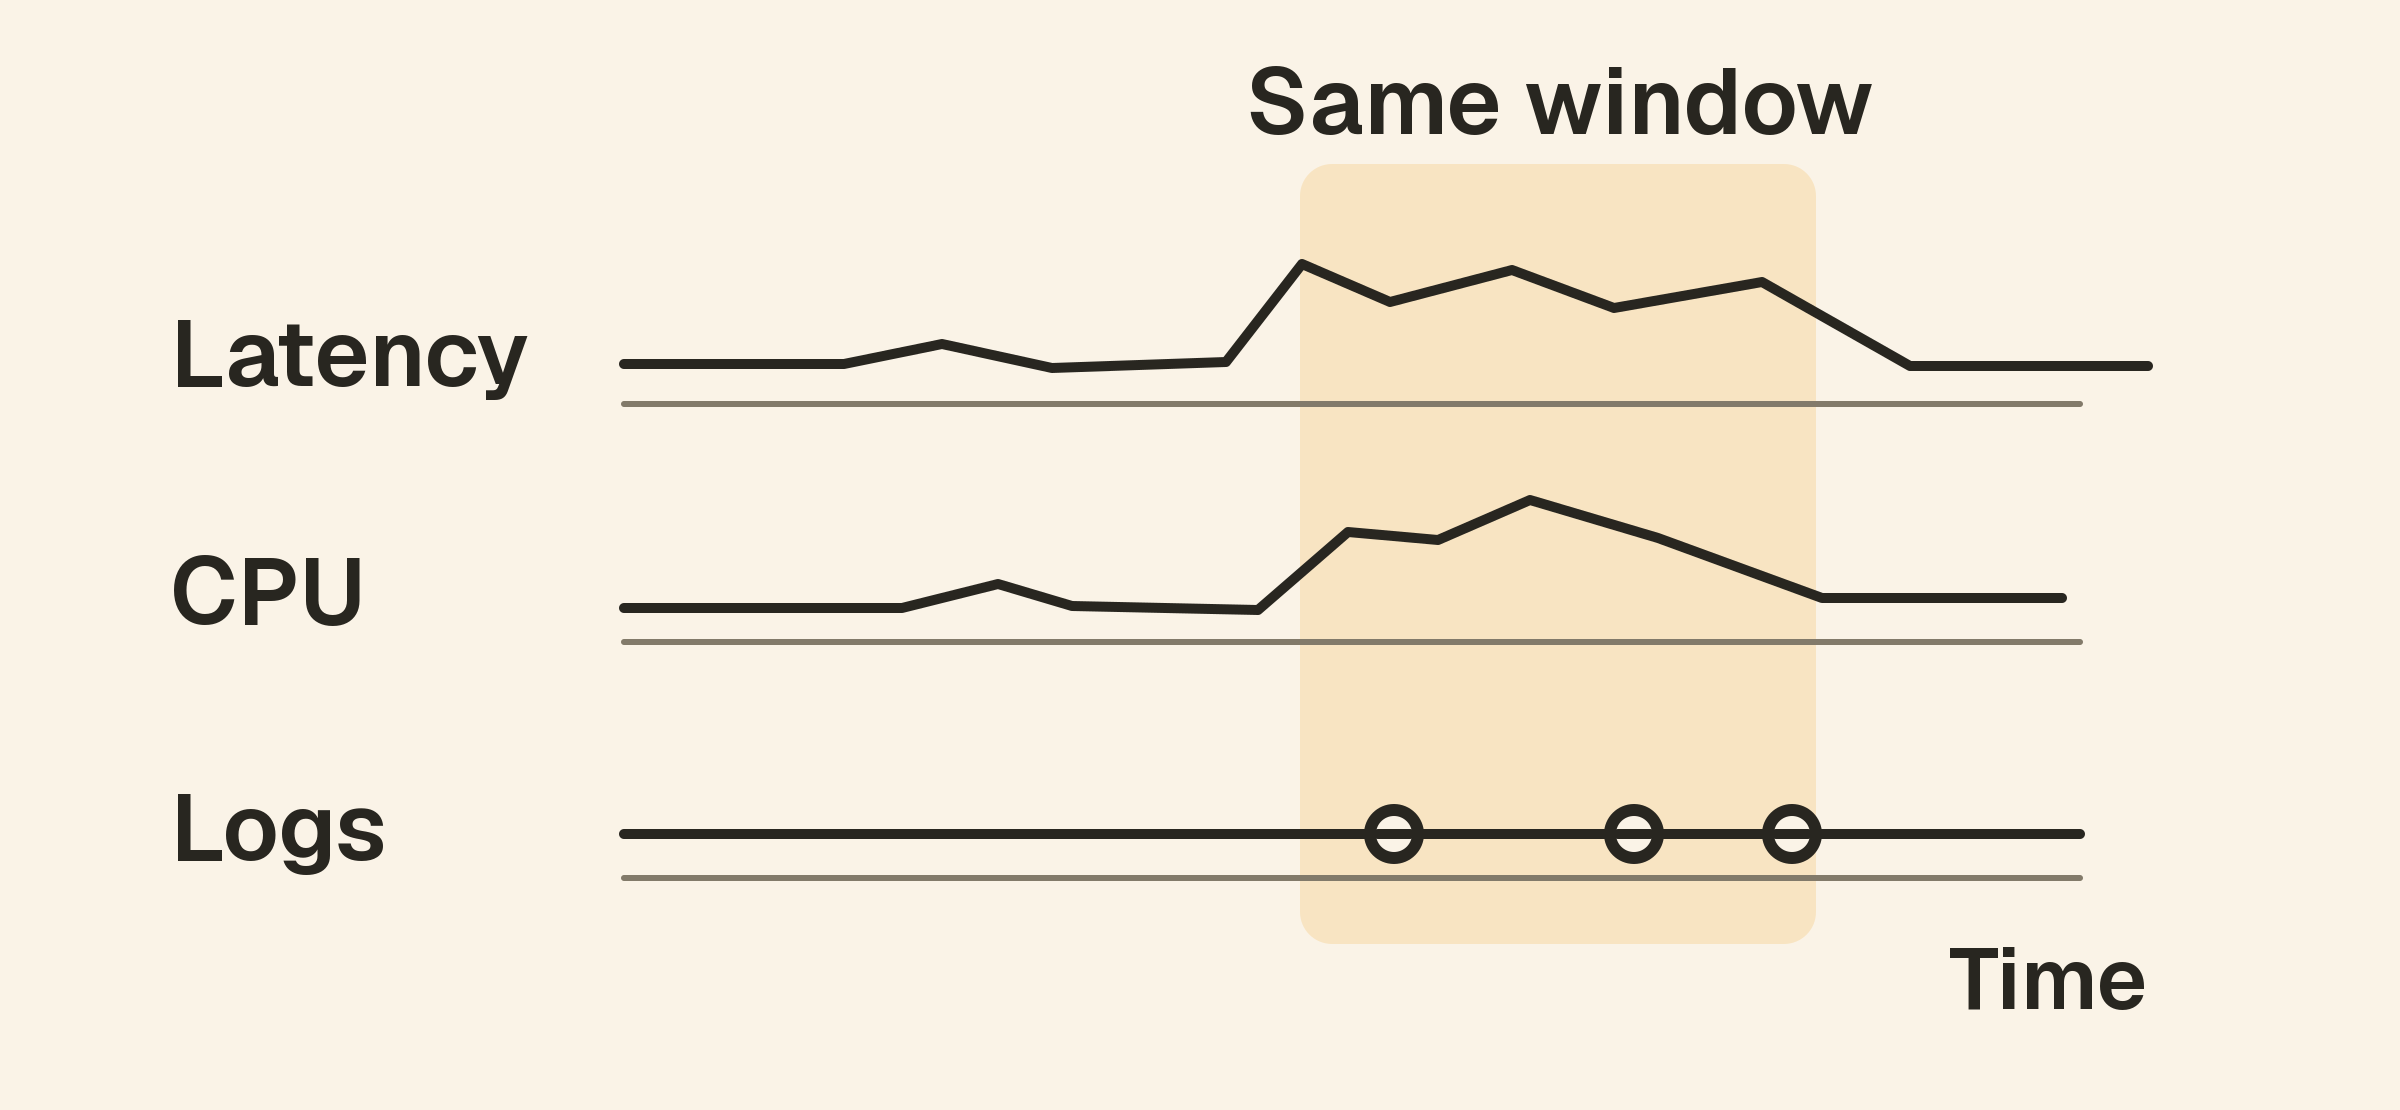
Choose a time range around the first verified slowdown and compare it with a normal period. Keep timestamps and timezones consistent across external monitors, host charts, application logs and deployment history.
Start with a narrow enough window to see changes clearly, then widen it if you need context. A daily average can hide a five-minute problem, while a very short view can make normal variation look unusual.
Check that the metrics are fresh and come from the intended host. A disconnected collector’s last value is not current evidence. In containerized deployments, verify whether a chart describes the host, one container or a resource quota.
The host monitoring documentation explains supported collection and setup. Additional diagnostics may be necessary for metrics your monitoring platform does not collect.
Check CPU utilization and workload together
Sustained CPU activity around the slowdown is a reason to investigate the work consuming it. Compare the affected period with request volume, scheduled jobs and recent releases. A new background export could compete with web requests even though the public traffic has not changed.
Look beyond the overall average where tools permit. A single busy core, container CPU limit or throttled workload can affect an application while the entire machine appears only moderately busy. Establish what the displayed percentage measures before deciding that CPU capacity is sufficient.
A high CPU value is not automatically a fault. It can represent expected useful work. The important question is whether processing demand or waiting for execution explains the affected requests.
Use process-level diagnostics or a profiler when needed to identify the workload. Avoid increasing server size solely because a CPU chart rises at roughly the same time as a slow page.
Interpret memory with pressure and process behavior
A high memory-used percentage needs context. Linux uses memory for caches, and a small “free” number alone does not establish that the machine is struggling. The Linux memory-information reference distinguishes fields such as free memory, cached data and estimated available memory.
Look for evidence of pressure: reduced available memory, active swapping, process restarts or allocation failures in relevant logs. Compare these signals with the application’s request timing and recent changes.
If one process grows steadily, investigate whether its memory use matches workload, caching behavior or a leak. Restarting it may reduce immediate pressure, but that does not explain why the growth occurred.
Record the observations before mitigation where practical. A restart can remove useful context, and temporary recovery does not prove that the underlying problem has been corrected.
Separate storage capacity from storage performance
Disk space and disk speed are different questions. A nearly full filesystem can cause writes to fail, while a disk with plenty of free space can still become a bottleneck under heavy I/O.
Check capacity for the filesystems the application actually uses, including database files, logs and temporary directories. Then inspect I/O latency, queueing or throughput with your system’s tools if storage performance is a plausible contributor.
Do not assume that a dashboard’s disk-use percentage measures I/O latency. Some monitoring setups collect capacity but require additional tools for detailed device performance.
Compare storage activity with backups, imports and other scheduled work. If a heavy task overlaps the slowdown, use that observation to form a testable hypothesis. Do not delete unfamiliar files or disable backups as a speculative first step.
Use load average as context, not a CPU percentage
On Linux, load average includes runnable work and tasks in uninterruptible wait, commonly associated with I/O. The Linux load-average reference describes that distinction.
Interpret the number alongside available CPU capacity and the workload. A high load average with moderate CPU utilization can lead you to investigate waiting or contention rather than immediately conclude that CPU is exhausted.
Comparing load, CPU and storage evidence is more useful than assigning the same universal load threshold to every machine. Containers and virtualized environments also need attention to their actual limits.
Inspect the path beyond the host
If the machine metrics do not explain the slowdown, inspect the application and its dependencies. A database query, remote API, lock or connection pool can delay responses without producing high CPU on the web host.
Use application logs, traces and dependency diagnostics where available. API checks can help identify whether a particular endpoint or external service is affected. DNS monitoring and SSL monitoring add context for failures before the application returns content.
A healthy host chart is a reason to continue investigating other layers, not a reason to reject a verified report of slowness. The website versus server monitoring guide explains why those views answer different questions.
Build and test a specific hypothesis
Suppose a catalogue endpoint becomes slow every night during a database export. CPU stays near its normal range, while storage latency and query duration increase during the same window. That is a useful hypothesis about contention, not final proof.
Review the export’s behavior and application evidence. In an appropriate controlled test or planned change, adjust the workload or schedule and compare the outcome. Keep other changes limited so the result remains interpretable.
Brendan Gregg’s USE Method provides a structured way to ask about resource utilization, saturation and errors. Use that structure to guide evidence collection rather than jump between unrelated charts.
Document what would confirm or weaken your hypothesis. If the slowdown persists after the proposed cause is removed, revise the explanation instead of forcing the charts to fit it.
Verify recovery from the outside
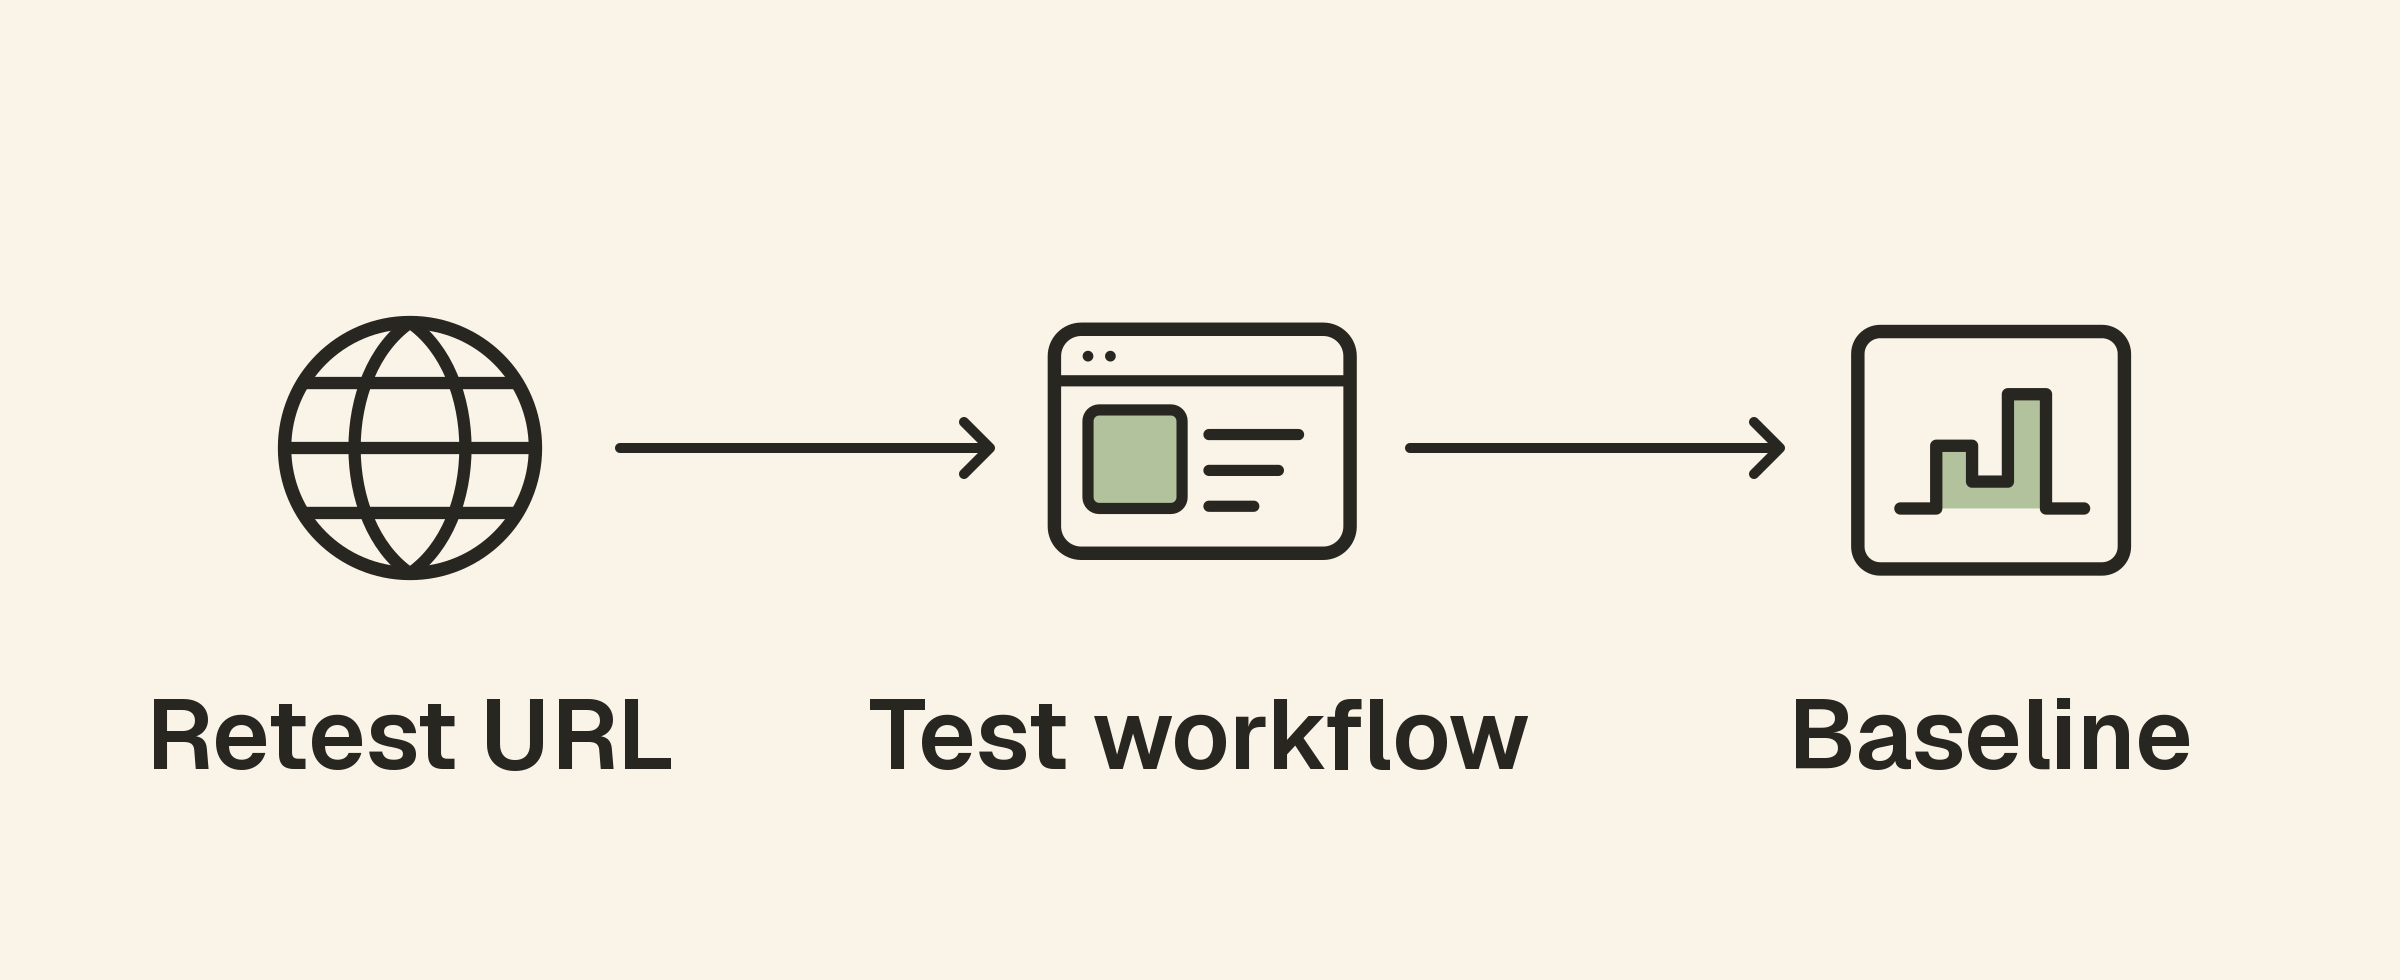
After mitigation, retest the affected page or API and compare its response behavior with the earlier baseline. Confirm that the relevant user workflow works, not just that a process restarted or a host threshold returned to normal.
Review a representative period if the issue depends on recurring traffic or a scheduled task. A fast response immediately after a restart may not reflect the next busy period.
If users were affected, update the status page with verified progress and recovery. Then improve the relevant monitor, alert rule or response instructions based on what the incident revealed.
A repeatable investigation checklist
- Confirm the affected workflow, region and time.
- Distinguish connection, response and browser-side delays.
- Align timestamps and check that host data is current.
- Review CPU, memory and storage with workload context.
- Interpret load average according to the operating system.
- Inspect logs, dependencies and recent changes.
- Test one supported hypothesis through a controlled change.
- Verify recovery using the affected external workflow.
Frequently asked questions
Does low CPU mean the server cannot be responsible?
No. Requests may wait on storage, locks, memory pressure or an application resource limit. Inspect the relevant evidence before excluding the server or application.
Should I upgrade the server first?
Only when evidence supports a capacity constraint and the change fits your operational plan. A larger machine will not automatically fix a bad query, a slow dependency or a configuration error.
Are server metrics enough to explain every slow page?
No. They provide infrastructure context. Browser diagnostics, external checks, application logs and traces may be needed to explain the complete experience.