
Uptime tells you whether a service met its availability rules during a measured period. Response time tells you how long a particular request took. Both matter because a website can remain reachable while becoming too slow to use comfortably, and a fast response can still contain the wrong result.
A useful reliability view combines availability, speed and response correctness. It also explains where measurements come from and what they cover. Without that context, a green uptime percentage can conceal a painful experience and a single slow sample can look more alarming than it should.
This guide shows how to read the two signals together and turn them into practical monitoring rules.
What does uptime measure?
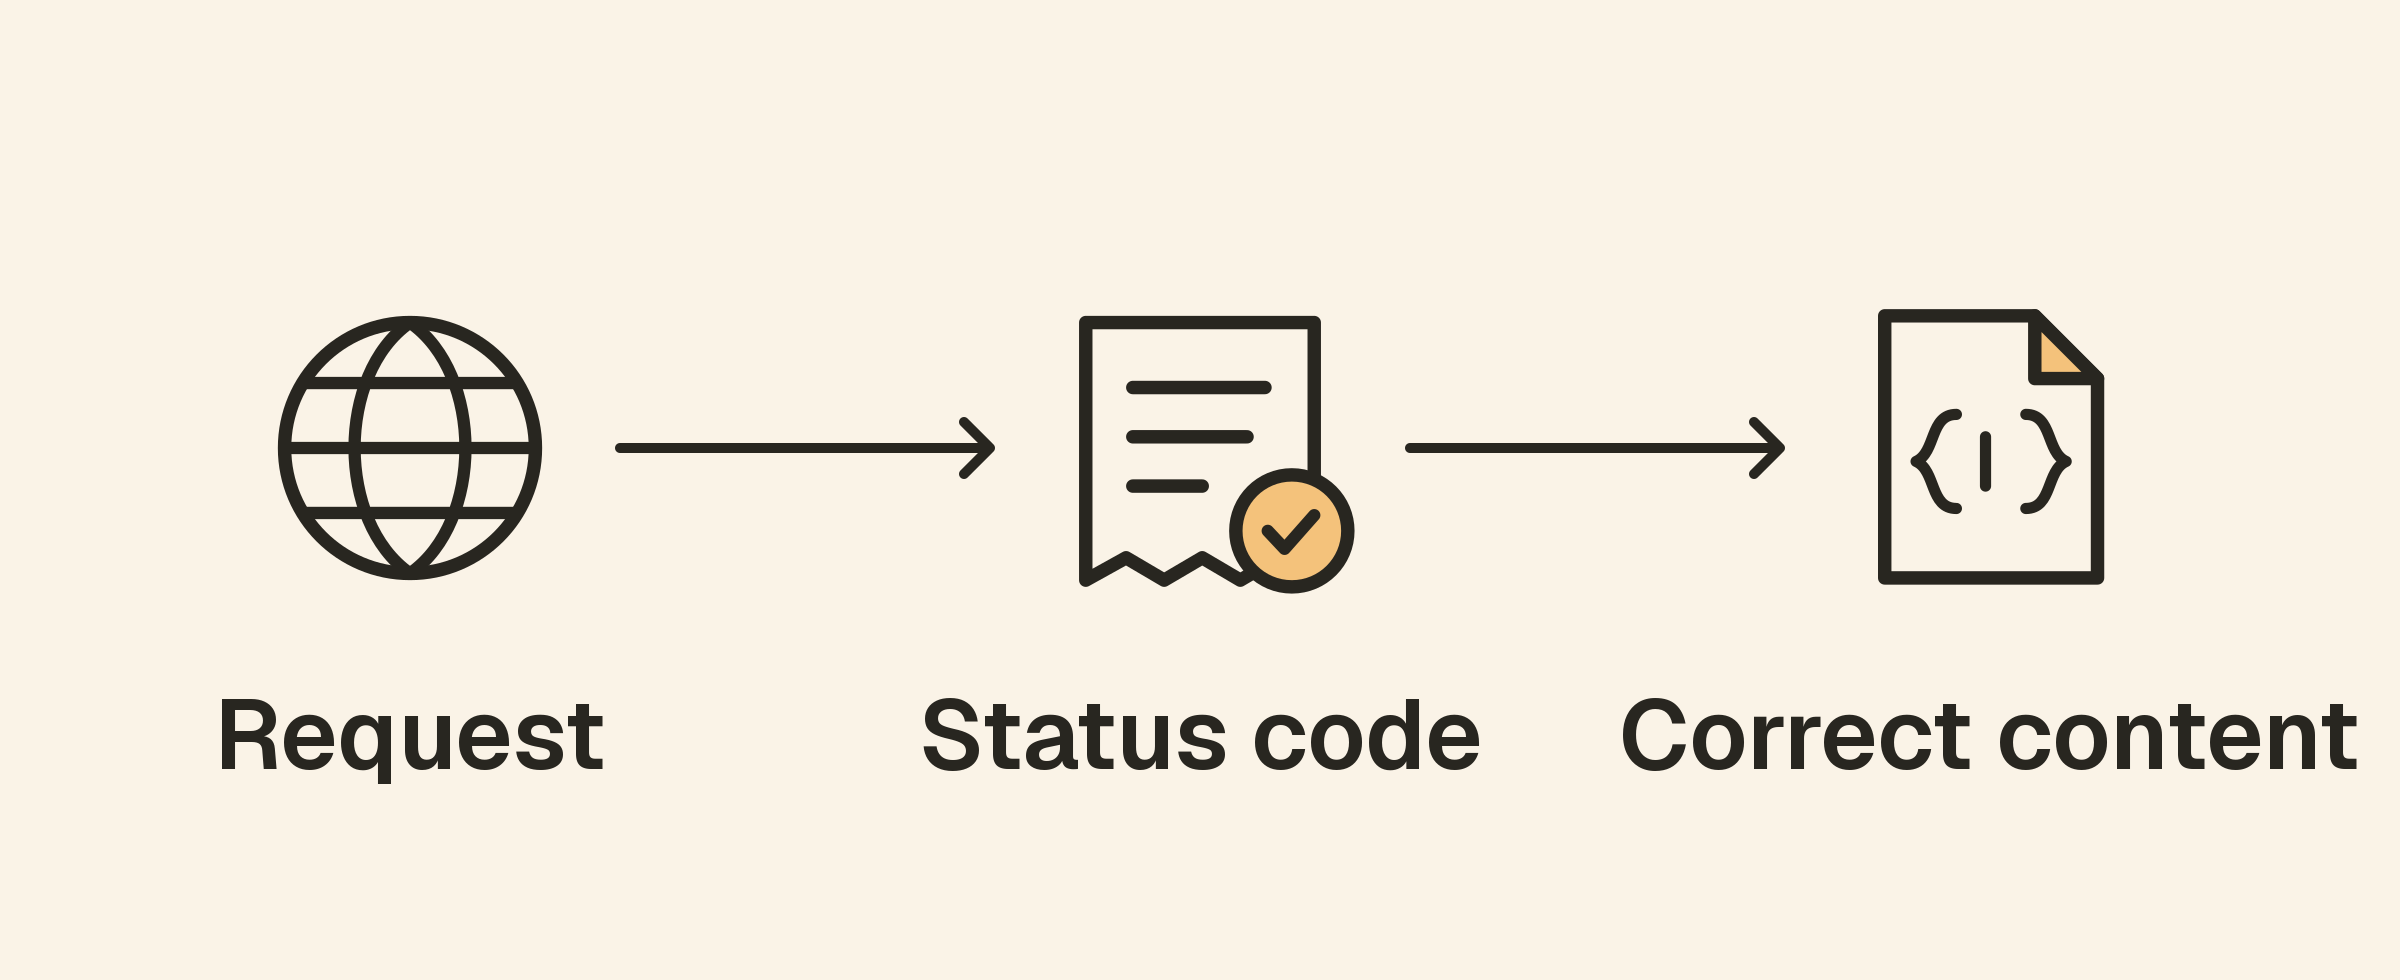
Uptime describes availability according to a defined test. For a website, that test might require an HTTPS response, an accepted status code and expected content. For an API, it might also require valid JSON and a particular field value.
That definition matters. A check accepting any response is different from a check that verifies a useful application result. An error document returning HTTP 200 can pass a status-only rule even when visitors cannot complete their work.
Monitoring tools can calculate availability from successful check samples, estimated outage duration or other methods. Review the reporting method, period and maintenance treatment before comparing percentages from different systems. The uptime monitoring introduction explains the basic calculation and sampling limitations.
What does response time measure?
Response time is the duration recorded for a request or operation. A monitoring tool may measure the complete HTTP request or expose separate stages such as DNS lookup, connection establishment, TLS negotiation, waiting for the first byte and downloading the response.
Compare measurements with the same boundaries. A full response download and time to first byte are different measurements. A larger response may take longer to transfer even if the application begins answering just as quickly.
Browser experience has additional stages. Rendering, JavaScript execution and interaction delays can make a page feel slow after the server response has arrived. External HTTP monitoring provides a useful signal, but it does not replace browser performance measurements or application instrumentation.
Four situations your dashboard should distinguish
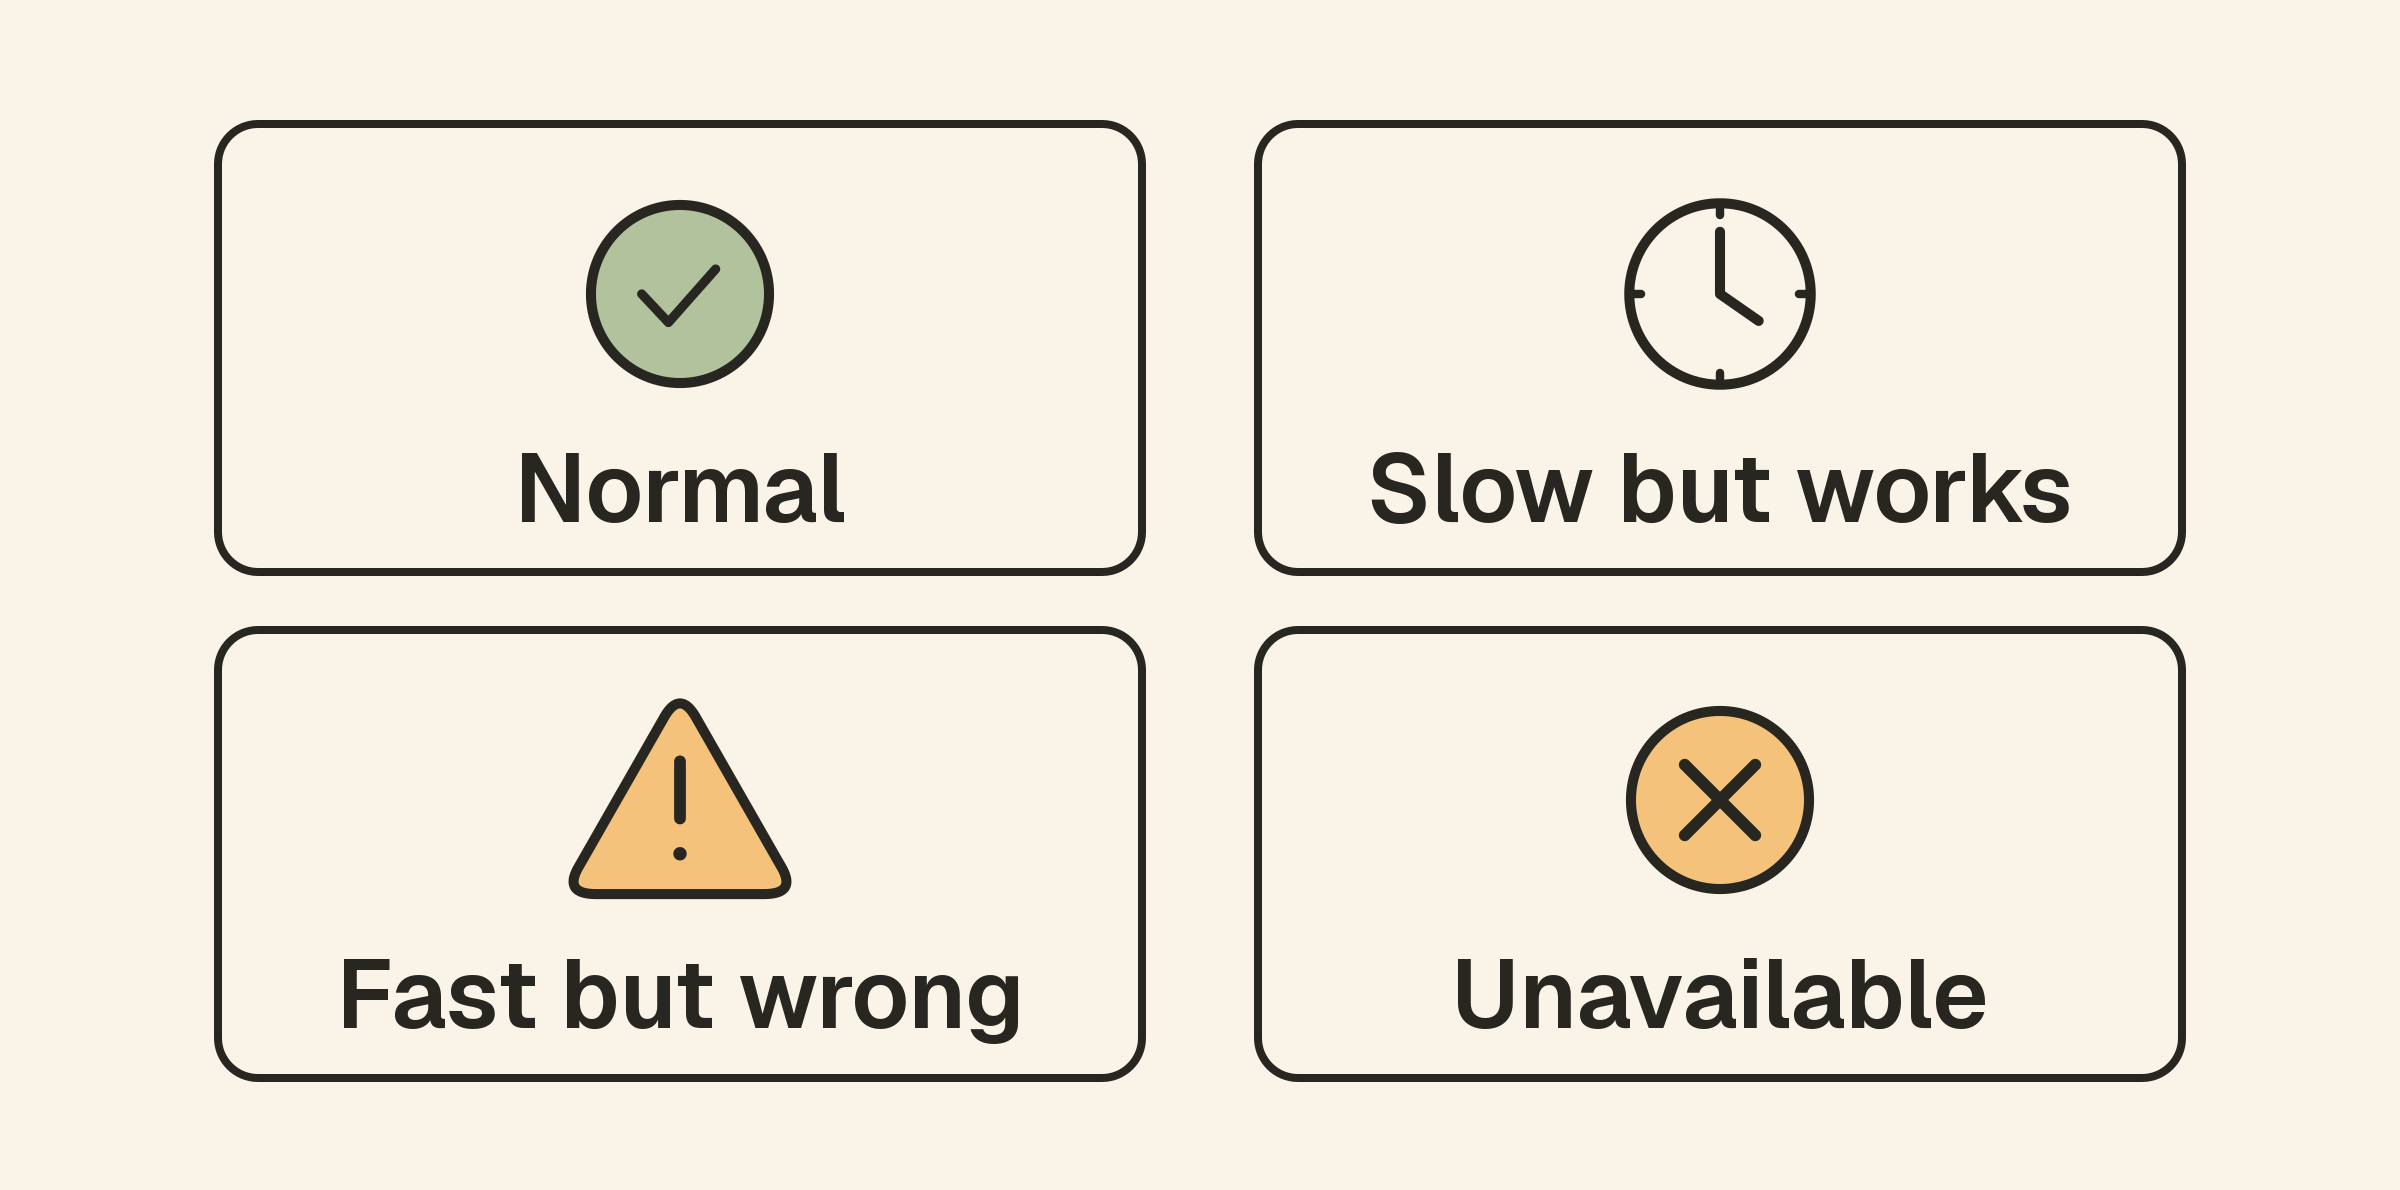
Available and responding normally
The request passes its correctness rules and its duration is consistent with the service’s expected behavior. This is useful evidence about the tested endpoint at that time, from the chosen location.
It does not prove every page, customer account or integration is healthy. Keep that scope explicit when communicating service status.
Available but slower than expected
The request succeeds but takes longer than the threshold appropriate to its purpose. A slow catalogue endpoint may delay a page; a slow checkout request may exceed the calling application’s own timeout.
A degraded-speed signal helps separate this condition from a complete failure. Website monitoring and API monitoring can supply external response evidence for the services you run.
Responding quickly with the wrong result
A proxy can return a small error page quickly. An API can return a fast response with a failure flag. Low response time does not establish correctness.
Add stable content or JSON assertions where they express a real service requirement. Follow the API monitor guide to understand supported operators and how missing fields are evaluated.
Unavailable or timing out
A failed connection, rejected response or missed deadline means the check did not meet its success rules. Preserve the actual failure condition. A DNS lookup failure is different from an application response with an error status.
A timeout also affects interpretation of performance reports. Some dashboards summarize durations only for successful requests. If so, the worst failures may not appear in the displayed average. Check the reporting behavior before drawing a conclusion from a fast-looking chart during an outage.
Choose thresholds around a real requirement
Begin with the endpoint’s role and normal behavior. A lightweight health response and a large export should not automatically share the same speed threshold.
Compare normal periods and busier periods, then identify the point where slowness becomes operationally important. Include the caller’s expectations: a monitor waiting longer than the actual application can hide an experience that users already consider a failure.
Avoid treating a general industry number as a universal requirement. Document why the threshold exists, who responds and what investigation it should trigger. Use separate conditions for an unavailable response and a slow successful response when your tool supports them.
The alert configuration guide explains notification destinations, failed-check confirmation and escalation. Test the resulting behavior rather than assume the settings produce the detection time you intend.
Look at distributions and trends, not one average
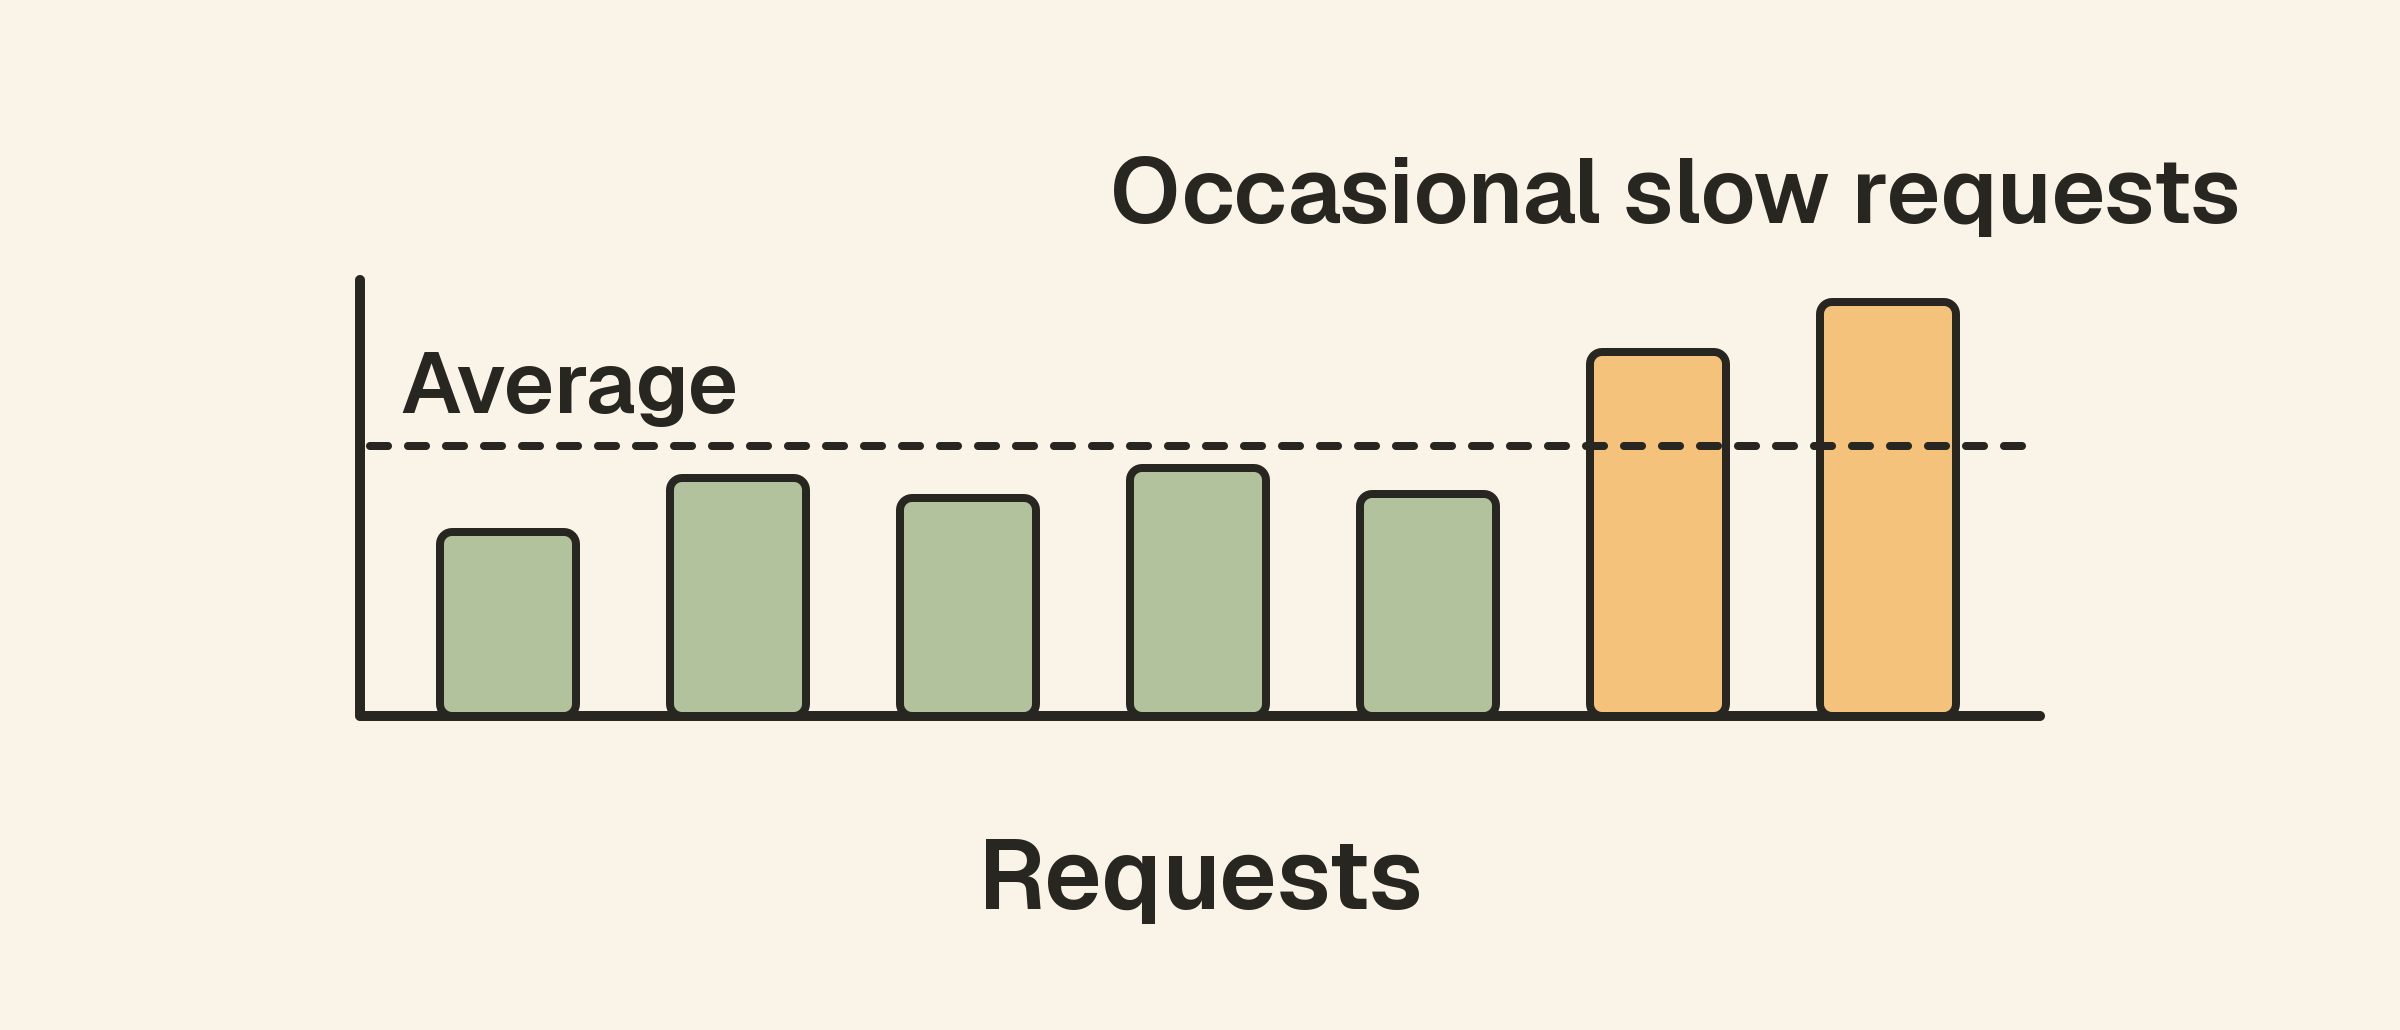
An average combines many observations into one number. It can conceal occasional very slow responses. Where you have enough representative data, percentiles can help describe the proportion of requests that fall below a duration.
Keep synthetic samples separate from production request measurements. A periodic monitor provides observations at its check interval. It cannot reconstruct the timing of every real request or establish the full distribution of all customer traffic.
Trends are still valuable. A response time that rises after a deployment, changes at a particular hour or differs by region gives the investigation a starting point. Compare like-for-like requests and avoid interpreting a changed payload or test location as a pure application regression.
Connect external symptoms with internal evidence
If availability remains high while response times increase, inspect host metrics, application logs and dependency behavior around the same timestamps. Resource contention, a slow database query or a remote API can all be plausible contributors.
A matching chart is a clue rather than proof. Verify whether the suspected condition explains the affected requests, and test a targeted change through your normal operating process.
For connection-stage problems, inspect DNS and certificate checks. For broader context, read website monitoring versus server monitoring.
An example of using both signals
Imagine a read-only product API that keeps passing its JSON assertions while response duration rises during a nightly import. An availability-only view remains green, but a latency rule identifies a service degradation worth investigating.
The team compares the incident window with database and host evidence, then tests a change to the import workload. Recovery is verified by the same external request and the affected user workflow.
This example does not imply that the import must be the cause. Its value is the sequence: observe the symptom, collect relevant context, test an explanation and confirm the outcome.
A practical setup checklist
- Define availability using the result the endpoint should provide.
- Know which stages your response-time metric includes.
- Choose timeouts and speed thresholds for each endpoint’s purpose.
- Keep errors visible when reviewing performance summaries.
- Compare consistent requests, regions and measurement periods.
- Pair external checks with application and infrastructure evidence.
- Test alerts and verify recovery from the user-facing side.
Frequently asked questions
Can a site have excellent uptime and still feel unreliable?
Yes. It may pass availability checks while key requests are slow or untested workflows fail. Availability needs a clear definition and complementary performance checks.
Is response time the same as page-load time?
No. An HTTP response is part of loading a page. Browser rendering, additional resources and JavaScript can add delays after that response.
Should slow responses count as downtime?
Define that according to the service requirement and reporting method. A degraded state can be useful, but keep the definition consistent so the team and customers understand the result.